

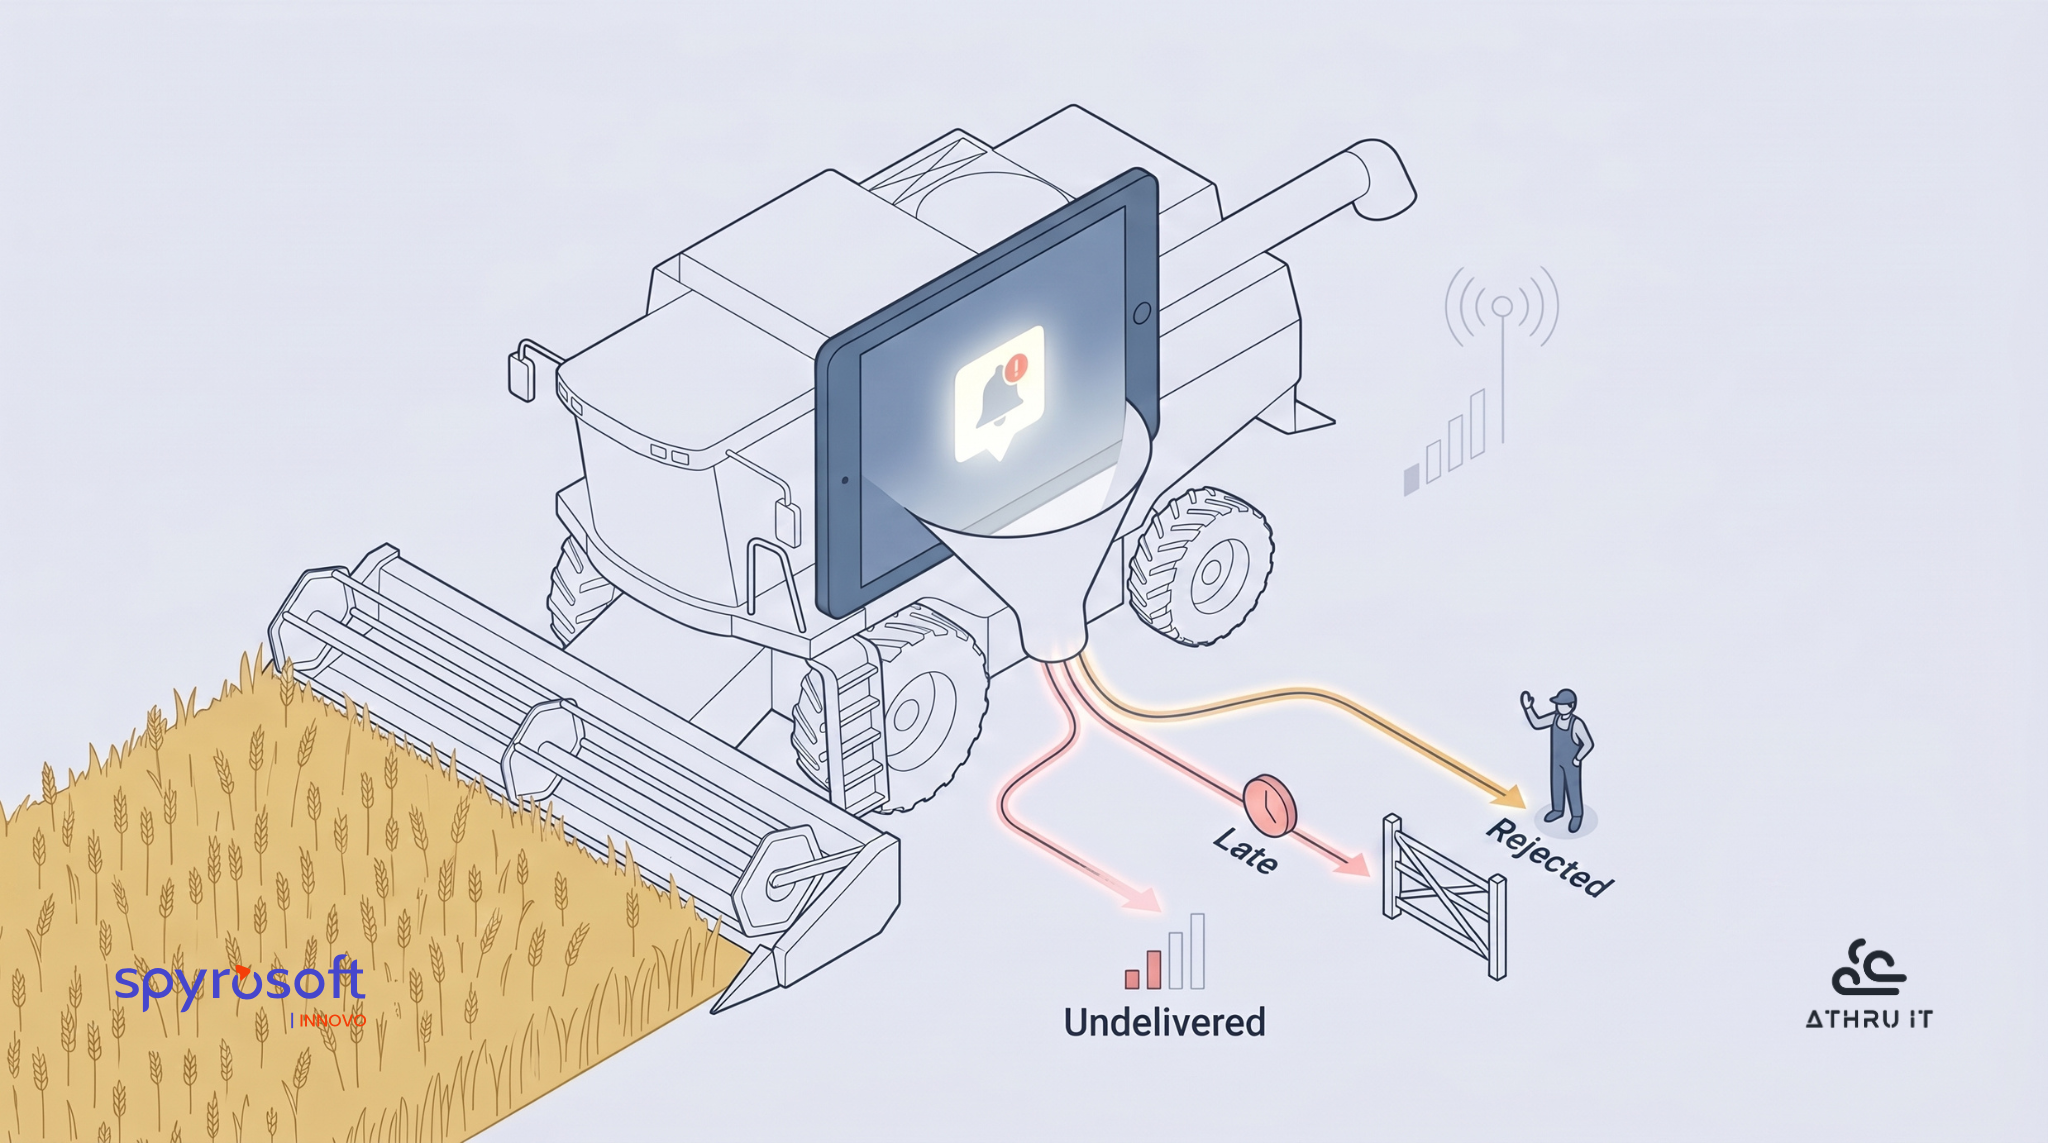
I have watched a variable rate nitrogen recommendation go out on a Tuesday morning and never get opened. The tablet was in a cab at the far end of a block with no signal, and the message landed three days later, after the spray window had shut. On the pilot dashboard that week it counted as one thing: a recommendation the agronomy team did not act on.
Most teams measuring a first season have accepted that ROI is not what this one measures. That was the argument in Why Agritech AI Pilots Fail at the Field Gate: Season 1 is the trust season, and the only question it answers honestly is whether the agronomy team has started to rely on the system. It also left the off-switch test: would any farm KPI change if you switched it off tomorrow?
So the metric names are settled. Recommendation acceptance rate. Override frequency. Both go on a dashboard within a fortnight, and neither one gets defined.
An acceptance rate with no stated denominator is worse than no acceptance rate, because it arrives looking like management information.
That Tuesday morning holds three failures, not one. Never delivered. Delivered outside the window. Delivered, read and rejected. Three owners, three fixes, and one number that sends engineering to retrain a model when part of the estate never received the output.
Season 1's real output is not a score. It is a definition. So: denominators, not another metric list.
What your acceptance rate is actually dividing by
Recommendation acceptance rate is the share of delivered, opened recommendations the agronomy team acts on. The load-bearing word is delivered. The denominator must exclude what never arrived: a recommendation that never reached a tablet measures your estate, not the advice.
Three delivery states, one owner each:
- Undelivered. It never reached a device. That is coverage, and it is your connectivity.
- Unopened or late. It reached a device outside the window it applied to. That is latency.
- Rejected. Somebody read it and did something else. The only state about the recommendation.
The first two are not edge cases. ICTworks documents twelve reasons a push-based agricultural message fails to reach or register with its recipient, none of them about whether the advice was sound: phones switched off to conserve battery in weak-grid areas, mobile data switched off to preserve a bundle, shared household devices, and messages deleted unread as presumed spam. The bundle case is worth separating out, because it delays delivery rather than blocking it. That is the latency bucket exactly.
This is structural, not one rollout's bad luck. The 2026 Frontiers systematic review of AI and machine learning in agriculture found connectivity and infrastructure gaps pervasive across the multi-region literature it covered, in 66 percent of its 38 studies, and puts the cause on tools built for farms that are data-rich, well connected and large.
The contrast is instructive. J-PAL's review of a phone-based advisory service reported nearly 90 percent of farmers with access calling the hotline over a two-year evaluation. That is one reliable channel the farmer initiates. A push notification into a cab has none of those advantages, and treating it as though it does is where most agritech AI pilot metrics go wrong.
So, the Tuesday morning. A recommendation that reached a tablet three days late in a field with no signal and was never opened is a coverage failure and a latency failure. It does not belong in the denominator.
Coverage also has to sit on the same screen, read first. Until you know what share of the estate received the output, no behavioural number underneath it means anything.
With the denominator fixed, the rejections still standing are the only ones about the recommendation. That is where the season's data lives.
Override frequency is signal, and the reason is the data
A rising override rate is not automatically bad and a falling one is not automatically good. Zero overrides is the reading that should worry you most: either nobody is opening the output, or nobody believes they are allowed to disagree with it.
An override carrying a recorded reason code is the highest-value data Season 1 produces. Not the rate. The reason.
The precedent is not agricultural. A 2019 study in the Journal of the American Medical Informatics Association found broken clinical decision-support rules by mining the free-text reasons clinicians typed when overriding an alert, rather than by watching rates: malfunctions in 62.5 percent of the rules it investigated. The rate looked stable throughout. The reasons were where the breakage was.
A 2024 study in the same journal supplies the shape of a working taxonomy: override comments cluster into recognisable, reusable categories per alert type. The same researchers also found raw comments unstructured, voluminous and redundant enough to need machine summarisation first. An open "why" box nobody reads is not better than no reason field.
Both are clinical. They are precedent for the shape of the mechanism, not evidence it has been proven in agriculture.
So keep it small and closed. Five codes carry almost everything you will see when an agronomist overrides the AI recommendation in front of them:
- Wrong for this field. The soil, the slope or the history does not fit.
- Wrong for this crop stage. Right action, wrong week.
- Right but not actionable this week. No machine, no labour, no window.
- Disagree with the agronomy. A professional judgment against the advice.
- Do not trust the data behind it. The inputs are stale or wrong.
Only the fourth disagrees with the model. The other four point at fixes somebody in the room can make.
With reasons in hand you can finally say what a bad number looks like, the question every reader arrives with and no page answers.
There is no benchmark, so read the pattern instead
Every reader wants a threshold. There is not one. No acceptance or override benchmark for agronomy teams exists in the public record, and the nearest well-sourced override figures belong to clinical decision support, produced by decades of electronic-record instrumentation in a compliance-heavy setting where alert, response and reason are captured by default. They do not transfer, and any AI pilot KPIs before ROI leaning on them borrow authority from another discipline.
At this stage, a bad number is a number you cannot decompose. Four patterns, each meaning something specific:
- Acceptance climbing while recorded reasons dry up. The team has stopped arguing with the system, and the data telling you why went with it.
- Acceptance that holds through the quiet weeks and collapses in the peak ones. The system is useful when there is time to consult it, which is when it matters least.
- Zero overrides. Nobody is reading it, or nobody thinks they may disagree.
- A number that cannot be split by field, crop or delivery state. It averages three different failures and points at the wrong fix.
Three of those four only become visible across weeks. Which is what a schedule is for.
The off-switch test, on the season's clock
The predecessor left the off-switch test as a question. Make it a practice: a named owner, a fixed date, a pass condition, and a consequence when it fails.
Run it four times against agronomic milestones rather than fiscal quarters: pre-season planning, in-season peak, harvest, post-season review. A quarter boundary landing in the middle of harvest is a meeting nobody attends, and the growing season is the only calendar this pilot runs on. That agronomic milestone cadence is what quarterly means.
The structure comes from outside agriculture. A 2026 Forbes Technology Council piece by Ofer Klein argues that a kill switch is not a governance strategy on its own, because it assumes a human is meaningfully in the loop for every action, and proposes a staged model instead: named ownership, behavioural baselines, graduated response, with the switch last rather than a substitute for the rest. That is one trade opinion piece, carrying the shape of the ritual rather than its authority. The part worth taking: a system needs a named human owner who understands its purpose and its expected behaviour. Name yours before the first run.
What the test reads is behaviour, not opinion:
- Does an agronomist consult the system before making a call, or after?
- Does use survive the peak-pressure weeks?
- Does anyone ask for it when it is down?
- Have the questions put to it got more specific across the season?
A fail on the last three is not a model problem, and retraining will not touch it.
The second thing the test reveals is more uncomfortable. Try to switch the system off and find out whether you are allowed to. A system nobody has the authority to switch off has not earned trust. It has been made mandatory. And an acceptance rate on a mandatory system measures compliance, not reliance.
Everything defined so far has to live somewhere a team can look at on a Tuesday.
The trust dashboard: nine fields, with definitions, sources, cadence and level
This is the section to hand to a data analyst. Nine fields for a trust dashboard for an AI pilot, each with a definition, a source, a refresh cadence and an aggregation level. Coverage and latency sit above the behavioural fields, because that ordering is the denominator argument rendered as layout.
Where the number comes from depends on your stack, and the platforms are not interchangeable. Climate FieldView and John Deere Operations Center interoperate on field boundaries, prescriptions, seeding, application and harvest data, with scripts built in FieldView shared to equipment through Operations Center. Semios is specialty crop, built on in-orchard sensors rather than row-crop machine data. AgriWebb is livestock-side, with paddock planning and team task assignment. PTx Trimble covers retrofit guidance and planter optimisation. Read your own log schema first.
- Recommendations issued. Every recommendation the system generated in the period. Source: advisory platform log. Refresh: daily. Level: team, field, crop.
- Delivery rate to a device. Share of those that reached a device at all. Source: message gateway or platform delivery receipt. Refresh: daily. Level: team, field.
- Delivery latency against the operational window. Time from issue to arrival, scored against the window it applied to. Source: platform timestamps plus the agronomic window. Refresh: daily. Level: field, crop.
- Recommendations opened. Share of delivered recommendations somebody opened. Source: platform read receipts. Refresh: daily. Level: team, field.
- Recommendation acceptance rate. Share of delivered, opened recommendations acted on, on the denominator defined above. Source: platform action log or task completion. Refresh: weekly. Level: team, field, crop.
- Override rate. Share of opened recommendations where the team did something else. Source: same log. Refresh: weekly. Level: team, field, crop.
- Override reason code capture rate. Share of overrides carrying a code. Source: the override form. Refresh: weekly. Level: team.
- Reason-code distribution. The five codes as a share of coded overrides. Source: the override form. Refresh: weekly. Level: team, crop.
- Data freshness. Age of the newest input behind a recommendation at the moment it was issued. Source: input pipeline timestamps. Refresh: daily. Level: field.
Acceptance and override both get broken out by field and by crop. Neither one, and nothing else on this list, aggregates to an individual agronomist.
That rule is measurement design, not workplace politics. A per-agronomist league table changes the behaviour it is trying to observe: people manage the score, and the number you were using to detect reliance quietly turns into one that produces compliance. Team, field and crop keep it diagnostic.
What stays off in Season 1: model accuracy, drift, retraining frequency. That is the supplier's dashboard. Yours measures whether the output arrived and what the team did with it.
One field on this list is doing a job the others are not.
ROI enters in Season 2, and here is what Season 1 has to record for it
ROI enters in Season 2.
Not Season 3, and the argument is the calendar rather than caution. One growing season is one observation with nothing to compare it against. A second season is the first like-for-like comparison you have. A third reduces the weather confound without removing it, so waiting buys a little rigour at the cost of a stakeholder who ran out of patience in month nine. When does an agricultural AI pilot show ROI: one season after the one that instrumented it.
There is nothing to cite here and I will not pretend otherwise. This is reasoning from a calendar, and reaching for a figure would import the false authority this piece argues against.
The condition is where the work is. Season 2 can carry an ROI number only if Season 1 captured the baseline alongside the pilot. Pre-AI baseline capture means recording the comparator at the same field and crop granularity, on the same cadence, from the season's start:
- Input spend per hectare.
- Agronomist hours per field visit.
- The interval between a problem appearing and an action taken, on the fields the pilot is not touching as well as the ones it is.
Half of that is already on the dashboard: freshness and coverage tell you which records are clean enough to compare against. The other half is the pre-AI comparator, and it has to be captured now, because you cannot reconstruct it in Season 2 from memory.
Say the scope out loud. A Season 2 number supports a claim about input spend and agronomist time against a like-for-like period. It will not settle yield attribution, because two weather years are still two weather years.
That gives you a date, the one thing the person asking this quarter can be handed.
What you report this quarter, and what would make you stop
Decide the keep or kill line now, before you need it, because after the fact the argument will be about the pilot's sponsor and not about the evidence.
First, the report you can defend this quarter without an ROI number. Five items from the instrument above, all of them AI pilot KPIs before ROI arrives:
- Coverage: the share of the estate that received output at all.
- Acceptance, with its denominator stated on the same slide.
- The reason-code distribution, which is the season's actual finding.
- The off-switch result from the most recent milestone run.
- The date the ROI question gets answered, committed in writing.
That is a defensible quarter: what arrived, what the team did with it, why, and when the number comes.
Now the keep or kill criteria, which most agritech pilots never write down until the argument has already started. To earn Season 2, the scorecard has to show three things:
- Coverage good enough that the behavioural numbers mean something.
- Reasons recorded against overrides.
- At least one off-switch pass.
To end it: the patterns from earlier persisting past a milestone run, after the fixes they pointed at were actually made. Not one bad quarter. A pattern that survives its fix is the agronomy team telling you it has decided, and running past that spends credibility you need next time.
Now back to the person all of this was built to observe.
What the season leaves behind
Go back to the Tuesday morning. Under a merged number, that recommendation was a rejection, and the fix it pointed at was the model. Under a defined one it is two entries: a delivery failure on a block with no signal, and a latency failure against a window that had already shut. Neither is about the advice, and both are fixable before the next spray window by people who are not data scientists.
That is what Season 1 leaves behind. Not a score. A definition, and a record clean enough that the next season can carry a number. The agronomist gets a system that arrives when it matters, and you get the only honest answer to your board's question: a date, and the evidence that the date is real.
If you are building that field list this month and want a second pair of eyes on it before it reaches your analyst, get in touch.